Comprehensive diagnostics and analysis of device parameters allows you to optimize the functioning of the entire data center. Because of this precious insight, you are able to avoid the dire consequences of potential failures, rationalize planning of device maintenance intervals, and significantly prolong the service life of devices. But not only that – proactive monitoring also helps to raise energy efficiency of the individual pieces of equipment, and consequently – the whole data center altogether.
Whether you succeed in turning your data center into a role model of economic maintenance depends to a large extent on the technical condition of your devices. Surprised? Wondering how exactly these two aspects are connected? Let us explain this sequence of dependencies to you in the most explicit manner which will not give you a headache along the way!
Keeping equipment shipshape is number one condition if you want your devices to be safe in exploitation, available for use at all times, durable and foolproof on top of that. Not to mention energy efficient which will translate into increased savings. And that is something you are striving for more than anything else, isn’t it?
As you can see for yourself, detailed diagnostics and round-the-clock monitoring are indispensable for preventing any sort of faults (and thus monstrous costs related to repairs). This, in practice, means observing the parameters and device properties during not only normal, everyday functioning but diagnostic processes as well.
EasyDCIM v1.4.4 provides you with all the necessary tools to review the state of each individual device in your possession. But even that is not the most utilitarian and exciting part of this ultramodern control panel. A couple of entirely new reports which allow you to readily inspect every single parameter of your devices is!
Have a closer look at these two powerful reports unlocked in your ‘Reports’ section!
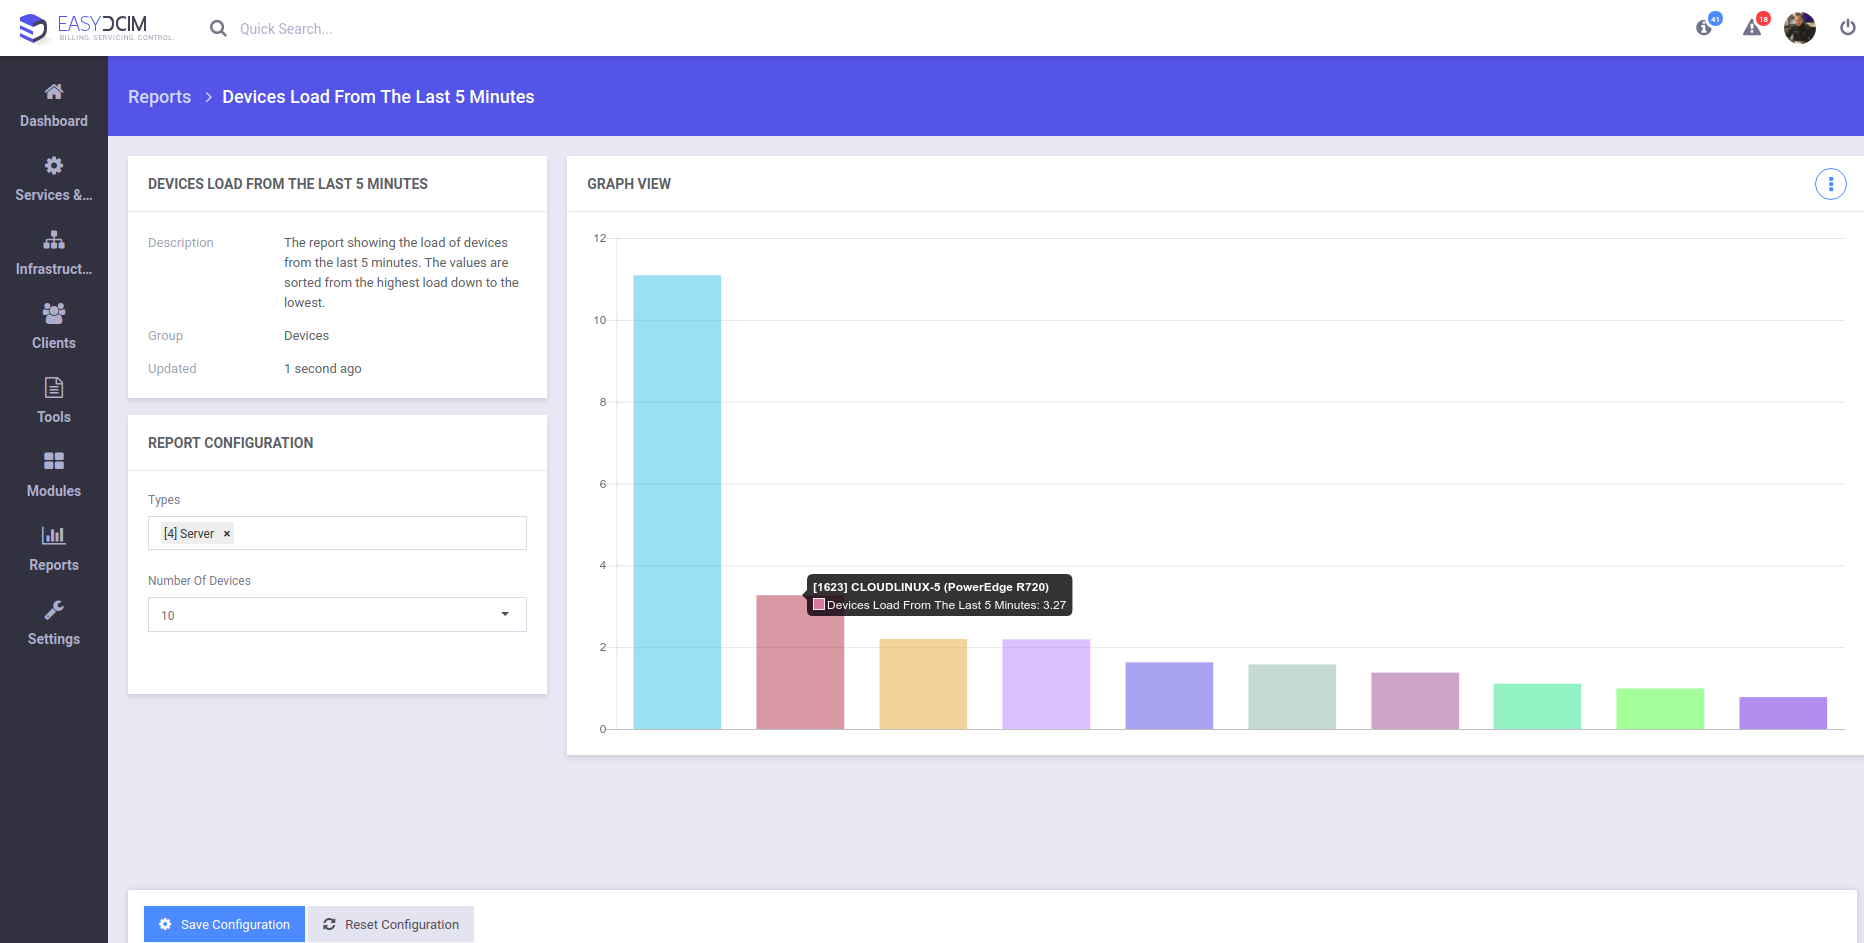
Devices Load From The Last 5 Minutes
Pretty easy to figure out what this report type is responsible for, isn’t it? That is right – it displays the total load of your devices from the last 5 minutes, automatically sorting the values from the highest to the lowest. In other words, it shows how many processes on average are running per CPU during a particular time. If, for example, your load equals 1.50, then it means that roughly one process is in the ‘Active’ state and 0.5 processes are in the ‘Standby’ state. A higher value always denotes the more overloaded state.
The collection of values is carried out through the polling process which polls the devices once every 5 minutes. The device polling is based on the SNMP protocol from which every 5 minutes the UCD-SNMP-MIB::laLoad value is downloaded.
The ‘Report Configuration’ section contains two fields:
- Types – choose the device types which are to be taken into account when generating a report.
- Number Of Devices – specify the number of devices which will be displayed in a report.
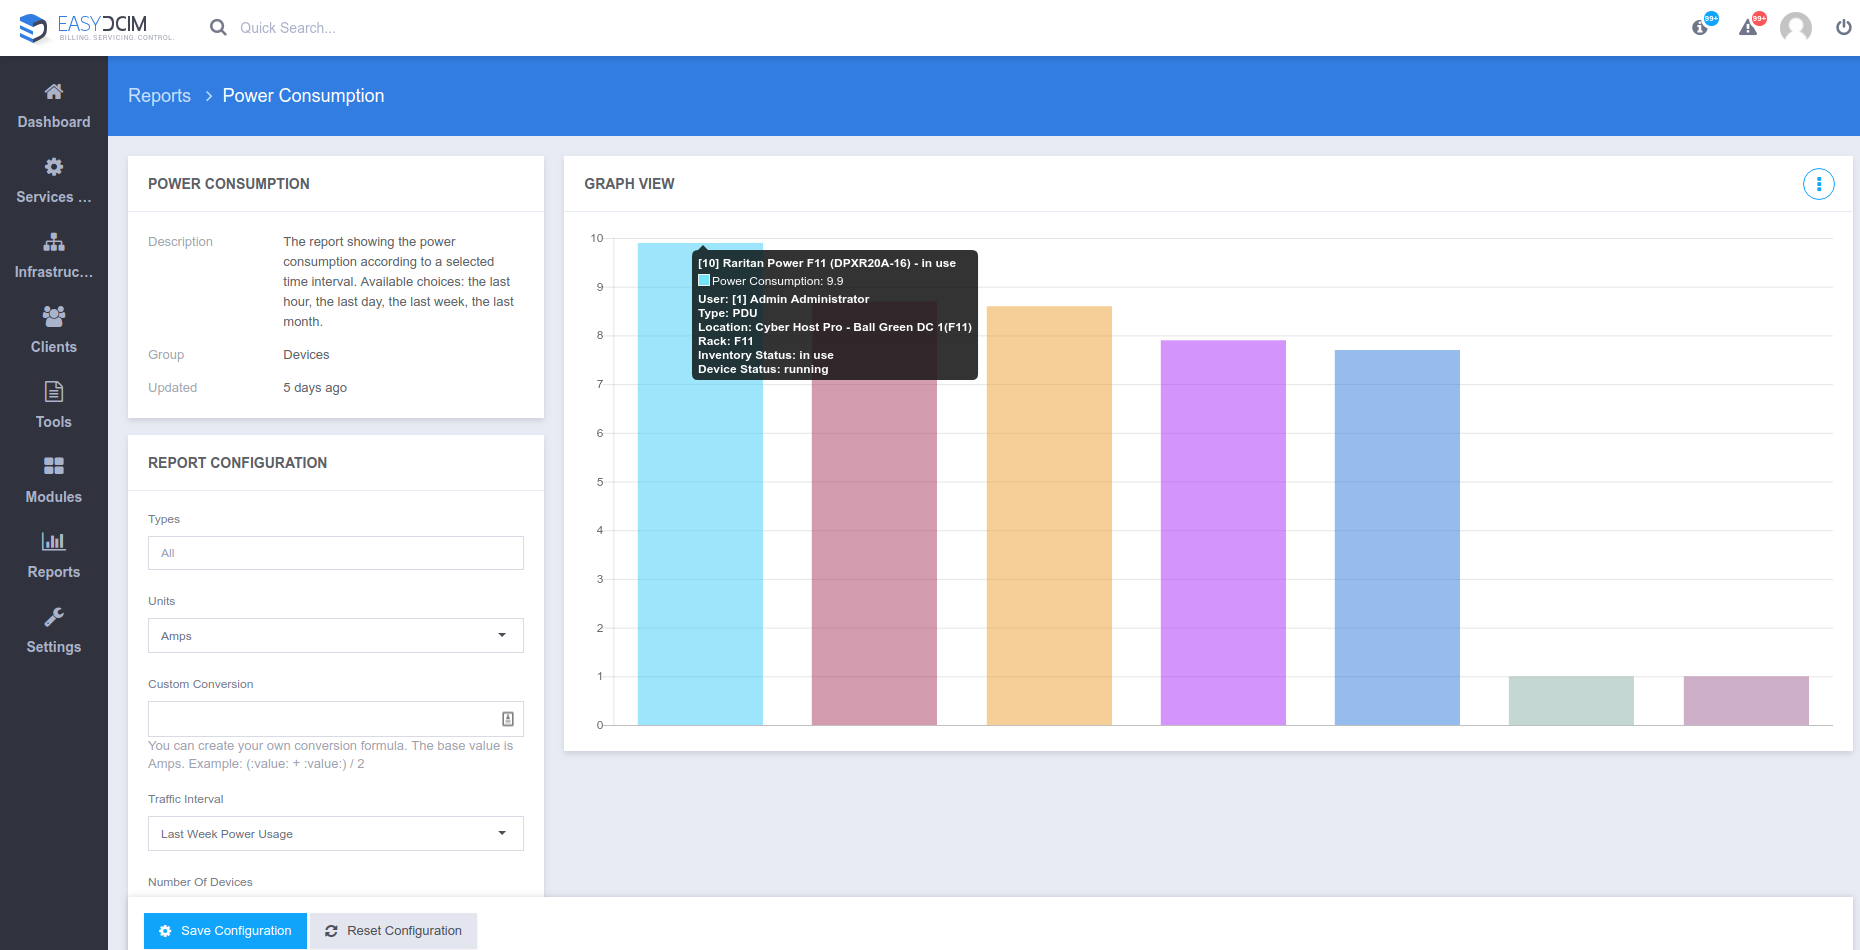
Power Consumption
This report type is just as straightforward and helpful as the previous one. What it does is show the power consumption of your devices from one of four selected time intervals: last hour, last day, last week, last month. Can you see the potential lying in such precious data? Here is a hint! Identify the devices that generate the most electricity consumption → work out the ways to reduce this high usage most effectively → grab an extra cup of coffee with your saved dollars!
The special process responsible for the collection of values is run once an hour and retrieves data on power consumption for PDUs and colocation from the following time intervals: last hour, last day, last week, last month. The device polling is based on the SNMP protocol from which the power consumption value is downloaded. Although the SNMP protocol is a primary source of data, specific device brands allow you to collect the values in other ways as well. In APC brand devices, for instance, data is retrieved using branches in the MIB tree with the value: 1.3.6.1.4.1.318.1.1.12.2.3.1.1.2.1 (PowerNet-MIB).
The ‘Report Configuration’ section contains five fields:
- Types – pick the device types which should be included when generating a report.
- Units – select counting units other than the default Amps. In addition, you can convert values into predefined kW for direct current at 230V or 120V.
- Custom Conversion – convert the values to the ones of your own choosing. The base value is Amps which can be freely recalculated using appropriate arithmetic operations.
- Traffic Interval – choose the time interval from which data will be collected. There are for at your disposal: last hour, last day, last week, last month.
- Number Of Devices – specify the number of devices which will be displayed in a report.
Key Benefits Of Device Monitoring With Dynamic Reports
By way of introduction, we outlined why device monitoring is such an important issue when looked at from the fundamental level as well as wider perspective. Devices which keep generating a large load over a long period of time can outlive their usefulness really quickly and simply fail. If that were not enough, increased device load generates greater demand for power thus leading to higher electricity bills. But having the two newly added reports at your disposal, you can react instantly to any arising threats stemming from either device overload or power consumption and prevent serious failures from ever taking place.
There is no better time than now to see how tremendous impact data center analysis has on the condition of your entire data center and… your wallet as well!


